Test Result Traceability Matrix Tool
I am often asked if there is a way to see a “traceability matrix” in TFS. Different people define a “traceability matrix” in different ways. If you want to see how many tests there are for a set of requirements, then you can use SmartExcel4TFS. However, this doesn’t tell you what state the current tests are in – so you can’t see how many tests are passing / failing etc.
Test Points
Of course this is because there is a difference between a test case and a test point in TFS. A test point is the combination of Test Case, Test Suite and Test Configuration. So let’s say you have Test ABC in Suite 1 and Suite 2 and have it for 2 configurations (Win7 and Win8, for example). Then you’ll really have 1 test case and 4 test points (2 suites x 2 configurations). So if you want to know “is this test case passing?” you really have to ask, “Is this test case passing in this suite and for this configuration?”.
However, you can do a bit of a “cheat” by making an assumption: if the most recent result is Pass/Fail/Not Run/Blocked, then assume the “result of the test” is Pass/Fail/Not Run/Blocked. Of course if the “last result” is failed, you’d have to find exactly which suite/configuration the failure relates to in order to get any detail. Anyway, for most situations this assumption isn’t too bad.
Test Result Traceability Matrix Tool
Given the assumption that the most recent test point result is the “result” of the Test Case, it’s possible to create a “test result traceability matrix”. If you plot Requirement vs Test Case in a grid, and then color the intersecting cells with the appropriate “result”, you can get a good idea of what state tests are in in relation to your requirements. So I’ve written a utility that will generate this matrix for you (see the bottom of this post for the link).
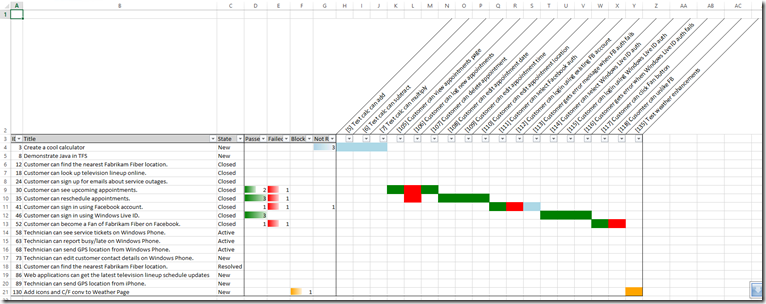
Here’s the output of a run:
The first 3 columns are:
- Requirement ID
- Requirement Title
- Requirement State
Then I sum the total of the test case results per category for that requirement – you can see that Requirement 30 has 2 Passed Tests and 1 Failed test (also 0 blocked and 0 not run). If you move along the same row, you’ll see the green and red blocks where the tests cases intersect with their requirements. The colors are as follows:
- Green = Passed
- Red = Failed
- Orange = Blocked
- Blue = Not Run
You can see I’ve turned on conditional formatting for the 4 totals columns. I’ve also added filtering to the header, so you can sort / filter the requirements on id, title or state.
Some Notes
This tool requires the following arguments:
- TpcUrl – the URL to the team project collection
- ProjectName – the name of the Team Project you’re creating the matrix for
- (Optional) RequirementQueryName – if you don’t specify this, you’ll get the matrix for all requirements in the team project. Alternatively, you can create a flat-list query to return only requirements you want to see (for example all Stories in a particular area path) and the matrix will only show those requirements.
I speak of “requirements” – the tool essentially gets all the work items in the “requirements category” as a top-level query and then fetches all work items in the “test case category” that are linked to the top-level items. So this will work as long as your process template has a Requirements / Test Case category.
The tool isn’t particularly efficient – so if you have large numbers of requirements, test cases and test plans the tool could take a while to run. Also, the tool selects the first “requirementsQuery” that matches the name you pass in – so make sure the name of your requirements query is unique. The tool doesn’t support one-hop or tree queries for this query either.
Let me know what you think!
Download
Here’s a link to the executable: you’ll need Team Explorer 2013 and Excel to be installed on the machine you run this tool from. To run it, download and extract the zip. The open up a console and run TestResultMatrix.exe.
Happy matrix generating!

