AppInsights Analytics in the Real World
Ever since Application Insights (AppInsights) was released, I’ve loved it. Getting tons of analytics about site usage, performance and diagnostics – pretty much for free – makes adding Application Performance Monitoring (APM) to you application a no-brainer. If you aren’t using AppInsights, then you really should be.
APM is the black sheep of DevOps – most teams are concentrating on getting continuous integration and deployment and release management, which are critical pillars of DevOps. But few teams are taking DevOps beyond deployment into APM, which is also fundamental to successful DevOps. AppInsights is arguably the easiest, least-friction method of quickly and easily getting real APM into your applications. However, getting insights from your AppInsights data has not been all that easy up until now.
Application Insights Analytics
A few days ago Brian Harry wrote a blog post called Introducing Application Insights Analytics. Internally, MS was using a tool called Kusto to do log analytics for many systems – including Visual Studio Team Services (VSTS) itself. (Perhaps Kusto is a reference perhaps to the naval explorer Jacques Cousteau – as in, Kusto lets you explore the oceans of data?) MS then productized their WPF Kusto app into web-based Application Insights Analytics. App Insights Analytics adds phenomenal querying and visualizations onto AppInsights telemetry, allowing you to really dig into the data AppInsights logs. Later on I’ll show you some really simple queries that we use to analyze our usage data.
Brian goes into detail about how fast the Application Insights Analytics engine is – and he should know since they process terrabytes worth of telemetry. Our telemetry is nowhere near that large, so performance of the query language isn’t that big a deal for us. What is a big deal is the analytics and visualizations that the engine makes possible.
In this post I want to show you how to get AppInsights into a real world application. Northwest Cadence has a Knowledge Library application and in order to generate tracing diagnostics and usage telemetry, we added AppInsights. We learned some lessons about AppInsights on the way, and here are some of our lessons-learned.
Configuring AppInsights
We have 4 sites that we deploy the same code to – there are 2 production sites, Azure Library and Knowledge Library, and each has a dev environment too. By default the AppInsights key is configured in ApplicationInsights.config. We wanted to have a separate AppInsights instance for each site, so we created 4 in Azure. Now we had the problem of where to set the key so that each site logs to the correct AppInsights instance.
Server-side telemetry is easy to configure. Add an app setting called “AIKey” in the web.config. In a startup method somewhere, you make a call to the Active TelemetryConfig: Microsoft.ApplicationInsights.Extensibility.TelemetryConfiguration.Active.InstrumentationKey = WebConfigurationManager.AppSettings["AIKey"];
This call then sets the AIKey for all serve-side telemetry globally. But what about client side?
For that we added a static getter to a class like this:
private static string aiKey;
public static string AIKey
{
    get
    {
        if (string.IsNullOrEmpty(aiKey))
        {
            aiKey = WebConfigurationManager.AppSettings.Get("AIKey");
        }
        return aiKey;
    }
}
In the master.cshtml file, we added the client-side script for AppInsights and made a small modification to get the key injected in instead of hard-coded:
<script type="text/javascript">
    var appInsights=window.appInsights||function(config){
        function s(config){t[config]=function(){var i=arguments;t.queue.push(function(){t[config].apply(t,i)})}}var t={config:config},r=document,f=window,e="script",o=r.createElement(e),i,u;for(o.src=config.url||"//az416426.vo.msecnd.net/scripts/a/ai.0.js",r.getElementsByTagName(e)[0].parentNode.appendChild(o),t.cookie=r.cookie,t.queue=[],i=["Event","Exception","Metric","PageView","Trace"];i.length;)s("track"+i.pop());return config.disableExceptionTracking||(i="onerror",s("_"+i),u=f[i],f[i]=function(config,r,f,e,o){var s=u&&u(config,r,f,e,o);return s!==!0&&t["_"+i](config,r,f,e,o),s}),t
    }({
        instrumentationKey: "@Easton.Web.Helpers.Utils.AIKey"
    });

    window.appInsights=appInsights;
    appInsights.trackPageView();
</script>
You can see how we’re using Razor syntax to get the AIKey static property value for the instrumentationKey value.
The next thing we wanted was to set the application version (assembly version) and site type (either KL for “Knowledge Library” or Azure for “Azure Library”). Perhaps this is a bit overkill since we have 4 separate AppInsights instances anyway, but if we decide to consolidate at some stage we can do so and preserve partitioning in the data.
Setting telemetry properties for every log entry is a little harder – there used to be an IConfigurationInitializer interface, but it seems it was deprecated. So we implemented an ITelmetryInitializer instance:
public class AppInsightsTelemetryInitializer : ITelemetryInitializer
{
    string appVersion = GetApplicationVersion();
    string siteType = GetSiteType();

    private static string GetSiteType()
    {
        return WebConfigurationManager.AppSettings["SiteType"];
    }

    private static string GetApplicationVersion()
    {
        return typeof(AppInsightsTelemetryInitializer).Assembly.GetName().Version.ToString();
    }

    public void Initialize(ITelemetry telemetry)
    {
        telemetry.Context.Component.Version = appVersion;
        telemetry.Context.Properties["siteType"] = siteType;
    }
}
In order to tell AppInsights to use the initializer, you need to add an entry to the ApplicationInsights.config file:
<TelemetryInitializers>
  ...
  <Add Type="Easton.Web.AppInsights.AppInsightsTelemetryInitializer, Easton.Web"/>
</TelemetryInitializers>
Now the version and siteType properties are added to every server-side log. Of course we could add additional “global” properties using the same code if we needed more.
Tracing
Last week we had an issue with our site – there’s a signup process in which we generate an access code and customers then enter the access code and enable integration with their Azure Active Directory so that their users can authenticate against their AAD when logging into our site. Customers started reporting that the access code “wasn’t found”. The bug turned out to be the fact that a static variable on a base class is shared across all child instances too – so our Azure Table data access classes were pointing to the incorrect tables (We fixed the issue using a curiously recurring generic base class – a study for another day) but the issue had us stumped for a while.
Initially I thought, “I can debug this issue quickly – I have AppInsights on the site so I can see what’s going on.” Turns out that there wasn’t any exception for the issue – the data access searched for an entity and couldn’t find it, so it reported the “access code not found” error that our customers were seeing. I didn’t have AppInsights tracing enabled – so I immediately set about adding it.
First, you install the Microsoft.ApplicationInsights.TraceListener package from NuGet. Then you can pepper your code with trace calls to System.Diagnostics.Trace – each one is sent to AppInsights by the TraceListener.
We decided to create an ILogger interface and a base class that just did a call to System.Diagnostics.Trace. Here’s a snippet:
public abstract class BaseLogger : ILogger
{
    public virtual void TraceError(string message)
    {
        Trace.TraceError(message);
    }

    public virtual void TraceError(string message, params object[] args)
    {
        Trace.TraceError(message, args);
    }

    public virtual void TraceException(Exception ex)
    {
        Trace.TraceError(ex.ToString());
    }

    // ... TraceInformation and TraceWarning methods same as above

    public virtual void TraceCustomEvent(string eventName, IDictionary<string, string> properties = null, IDictionary<string, double> metrics = null)
    {
        var propertiesStr = "";
        if (properties != null)
        {
            foreach (var key in properties.Keys)
            {
                propertiesStr += string.Format("{0}{1}{2}", key, properties[key], Environment.NewLine);
            }
        }


        var metricsStr = "";
        if (metrics != null)
        {
            foreach (var key in metrics.Keys)
            {
                metricsStr += string.Format("{0}{1}{2}", key, metrics[key], Environment.NewLine);
            }
        }

        Trace.TraceInformation("Custom Event: {0}{1}{2}{1}{3}", eventName, Environment.NewLine, propertiesStr, metricsStr);
    }
}
The TraceInformation and TraceError methods are pretty straightforward – the TraceCustomEvent was necessary to enable custom telemetry. Using the logger to add tracing and exception logging is easy. We inject an instance of our AppInsightsLogger (more on this later) and then we can use it to log. Here’s an example of our GET videos method (we use NancyFx which is why this is an indexer method):
Get["/videos"] = p =>
{
    try
    {
        logger.TraceInformation("[/Videos] Returning {0} videos", videoManager.Videos.Count);
        return new JsonResponse(videoManager.Videos, new EastonJsonNetSerializer());
    }
    catch (Exception ex)
    {
        logger.TraceException(ex);
        throw ex;
    }
};
Custom Telemetry
Out of the box you get a ton of great logging in AppInsights – page views (including browser type, region, language and performance) and server side requests, exceptions and performance. However, we wanted to start doing some custom analytics on usage. Our application is multi-tenant, so we wanted to track the tenantId as well as the user. We want to track each time a user views a video so we can see which users (across which tenants) are accessing which videos. Here’s the call we make to log that a user has accessed a video: logger.TraceCustomEvent("ViewVideo", new Dictionary<string, string>() { { "TenantId", tenantId }, { "User", userId }, { "VideoId", videoId } });
The method in the AppInsightsLogger is as follows:
public override void TraceCustomEvent(string eventName, IDictionary<string, string> properties = null, IDictionary<string, double> metrics = null)
{
    AppInsights.TrackEvent(eventName, properties, metrics);
}
Pretty simple.
Analytics Queries
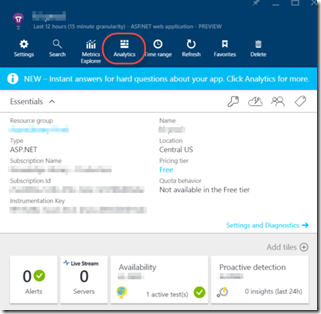
Now that we’re getting some telemetry, including requests and custom events, we can start to query. Logging on to the Azure Portal I navigate to the AppInsights instance and click on the Analytics button in the toolbar:
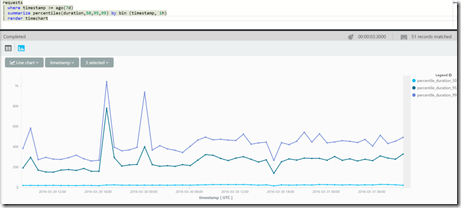
That will open the AppInsights Analytics page. Here I can start querying my telemetry. There are several “tables” that you can query – requests, traces, exceptions and so on. If I want to see the performance percentiles of my requests in 1 hour bins for the last 7 days, I can use this query which calculates the percentiles and then renders to a time chart:
requests
| where timestamp >= ago(7d)
| summarize percentiles(duration,50,95,99) by bin (timestamp, 1h)
| render timechart
The query syntax is fairly “natural” though I did have to look at these help docs to get to grips with the language.
Sweet!
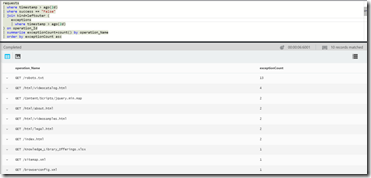
You can even join the tables. Here’s an example from Brian Harry’s post that correlates exceptions and requests:
requests
| where timestamp > ago(2d)
| where success == "False"
| join kind=leftouter (
    exceptions
    | where timestamp > ago(2d)
) on operation_Id
| summarize exceptionCount=count() by operation_Name
| order by exceptionCount asc
Note that I did have some trouble with the order by direction – it could be a bug (this is still in preview) or maybe I just don’t understand the ordering will enough.
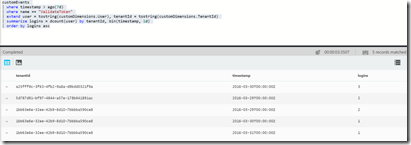
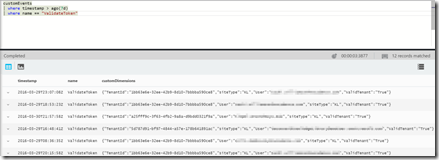
Here are a couple of queries against our custom telemetry:
customEvents
| where timestamp > ago(7d)
| where name == "ValidateToken"
| extend user = tostring(customDimensions.User), tenantId = tostring(customDimensions.TenantId)
| summarize logins = dcount(user) by tenantId, bin(timestamp, 1d)
| order by logins asc
Again, the ordering direction seems odd to me.
I love the way that the customDimensions (which is just a json snippet) is directly addressable. Here’s what the json looks like for our custom events:
You can see how the “siteType” property is there because of our ITelemetryInitializer.
Visualizations
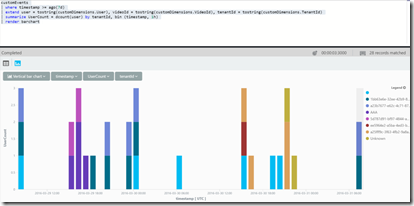
After writing a couple queries, we can then add a visualization by adding a render clause. You’ve already seen the “render timechart“ above – but there’s also piechart, barchart and table. Here’s a query that renders a stacked bar chart showing user views (per tenant) in hourly bins:
customEvents
| where timestamp >= ago(7d)
| extend user = tostring(customDimensions.User), videoId = tostring(customDimensions.VideoId), tenantId = tostring(customDimensions.TenantId)
| summarize UserCount = dcount(user) by tenantId, bin (timestamp, 1h)
| render barchart
This is just scratching the surface, but I hope you get a feel for what this tool can bring out of your telemetry.
Exporting Data to PowerBI
The next step is to make a dashboard out of the queries that we’ve created. You can export to Excel, but for a more dynamic experience, you can also export to PowerBI. I was a little surprised that when I clicked “Export to PowerBI” I got a text file. Here’s the same bar chart query exported to PowerBI:
/*
The exported Power Query Formula Language (M Language ) can be used with Power Query in Excel
and Power BI Desktop.
For Power BI Desktop follow the instructions below:
 1) Download Power BI Desktop from https://powerbi.microsoft.com/en-us/desktop/
 2) In Power BI Desktop select: 'Get Data' -> 'Blank Query'->'Advanced Query Editor'
 3) Paste the M Language script into the Advanced Query Editor and select 'Done'
*/


let
Source = Json.Document(Web.Contents("https://management.azure.com/subscriptions/someguid/resourcegroups/rg/providers/microsoft.insights/components/app-insights-instance/api/query?api-version=2014-12-01-preview",
[Query=[#"csl"="customEvents| where timestamp >= ago(7d)| extend user = tostring(customDimensions.User), videoId = tostring(customDimensions.VideoId), tenantId = tostring(customDimensions.TenantId)| summarize UserCount = dcount(user) by tenantId, bin (timestamp, 1h)| render barchart"]])),
SourceTable = Record.ToTable(Source),
SourceTableExpanded = Table.ExpandListColumn(SourceTable, "Value"),
SourceTableExpandedValues = Table.ExpandRecordColumn(SourceTableExpanded, "Value", {"TableName", "Columns", "Rows"}, {"TableName", "Columns", "Rows"}),
RowsList = SourceTableExpandedValues{0}[Rows],
ColumnsList = SourceTableExpandedValues{0}[Columns],
ColumnsTable = Table.FromList(ColumnsList, Splitter.SplitByNothing(), null, null, ExtraValues.Error),
ColumnNamesTable = Table.ExpandRecordColumn(ColumnsTable, "Column1", {"ColumnName"}, {"ColumnName"}),
ColumnsNamesList = Table.ToList(ColumnNamesTable, Combiner.CombineTextByDelimiter(",")),
Table = Table.FromRows(RowsList, ColumnsNamesList),
ColumnNameAndTypeTable = Table.ExpandRecordColumn(ColumnsTable, "Column1", {"ColumnName", "DataType"}, {"ColumnName", "DataType"}),
ColumnNameAndTypeTableReplacedType1 = Table.ReplaceValue(ColumnNameAndTypeTable,"Double",Double.Type,Replacer.ReplaceValue,{"DataType"}),
ColumnNameAndTypeTableReplacedType2 = Table.ReplaceValue(ColumnNameAndTypeTableReplacedType1,"Int64",Int64.Type,Replacer.ReplaceValue,{"DataType"}),
ColumnNameAndTypeTableReplacedType3 = Table.ReplaceValue(ColumnNameAndTypeTableReplacedType2,"Int32",Int32.Type,Replacer.ReplaceValue,{"DataType"}),
ColumnNameAndTypeTableReplacedType4 = Table.ReplaceValue(ColumnNameAndTypeTableReplacedType3,"Int16",Int16.Type,Replacer.ReplaceValue,{"DataType"}),
ColumnNameAndTypeTableReplacedType5 = Table.ReplaceValue(ColumnNameAndTypeTableReplacedType4,"UInt64",Number.Type,Replacer.ReplaceValue,{"DataType"}),
ColumnNameAndTypeTableReplacedType6 = Table.ReplaceValue(ColumnNameAndTypeTableReplacedType5,"UInt32",Number.Type,Replacer.ReplaceValue,{"DataType"}),
ColumnNameAndTypeTableReplacedType7 = Table.ReplaceValue(ColumnNameAndTypeTableReplacedType6,"UInt16",Number.Type,Replacer.ReplaceValue,{"DataType"}),
ColumnNameAndTypeTableReplacedType8 = Table.ReplaceValue(ColumnNameAndTypeTableReplacedType7,"Byte",Byte.Type,Replacer.ReplaceValue,{"DataType"}),
ColumnNameAndTypeTableReplacedType9 = Table.ReplaceValue(ColumnNameAndTypeTableReplacedType8,"Single",Single.Type,Replacer.ReplaceValue,{"DataType"}),
ColumnNameAndTypeTableReplacedType10 = Table.ReplaceValue(ColumnNameAndTypeTableReplacedType9,"Decimal",Decimal.Type,Replacer.ReplaceValue,{"DataType"}),
ColumnNameAndTypeTableReplacedType11 = Table.ReplaceValue(ColumnNameAndTypeTableReplacedType10,"TimeSpan",Duration.Type,Replacer.ReplaceValue,{"DataType"}),
ColumnNameAndTypeTableReplacedType12 = Table.ReplaceValue(ColumnNameAndTypeTableReplacedType11,"DateTime",DateTimeZone.Type,Replacer.ReplaceValue,{"DataType"}),
ColumnNameAndTypeTableReplacedType13 = Table.ReplaceValue(ColumnNameAndTypeTableReplacedType12,"String",Text.Type,Replacer.ReplaceValue,{"DataType"}),
ColumnNameAndTypeTableReplacedType14 = Table.ReplaceValue(ColumnNameAndTypeTableReplacedType13,"Boolean",Logical.Type,Replacer.ReplaceValue,{"DataType"}),
ColumnNameAndTypeTableReplacedType15 = Table.ReplaceValue(ColumnNameAndTypeTableReplacedType14,"SByte",Logical.Type,Replacer.ReplaceValue,{"DataType"}),
ColumnNameAndTypeTableReplacedType16 = Table.SelectRows(ColumnNameAndTypeTableReplacedType15, each [DataType] is type),
ColumnNameAndTypeList = Table.ToRows(ColumnNameAndTypeTableReplacedType16),
TypedTable = Table.TransformColumnTypes(Table, ColumnNameAndTypeList)
in
TypedTable
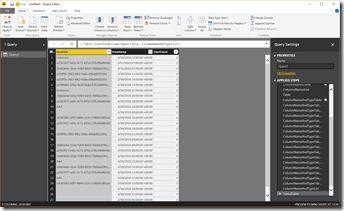
Ah, so I’ll need PowerBI desktop. No problem. Download it, open it and follow the helpful instructions in the comments at the top of the file:
Now I can create visualizations, add custom columns – do whatever I would normally do in PowerBI.
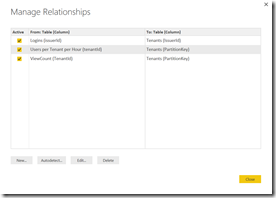
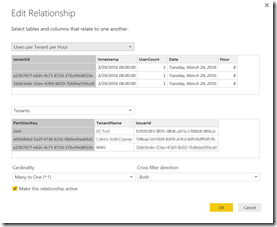
One thing I did want to do was fix up the nasty “tenantId”. This is a guid which is the Partition Key for an Azure Table that we use to store our tenants. So I just added a new Query to the report to fetch the tenant data from the table. Then I was able to create a relationship (i.e. foreign key) that let me use the tenant name rather than the nasty guid in my reports:
Here’s what the relationship looks like for the “Users Per Tenant Per Hour Query”:
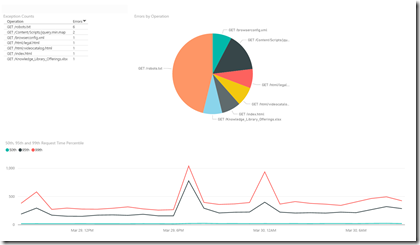
Once I had the tables in, I could create reports. Here’s a performance report:
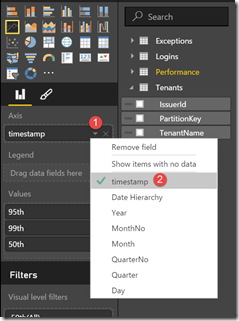
One tip – when you add the “timestamp” property, PowerBI defaults to a date hierarchy (Year, Quarter, Month, Day). To use the timestamp itself, you can just click on the field in the axis box and select “timestamp” from the values:
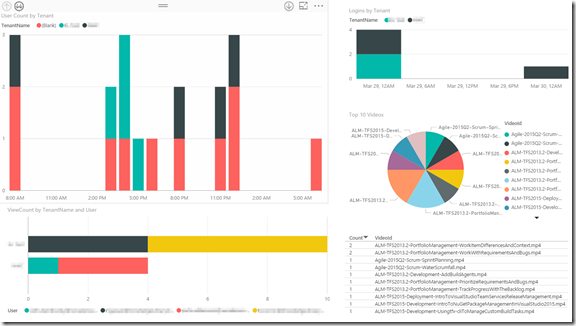
Here’s one of our usage reports:
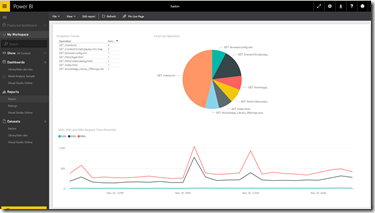
And of course, once I’ve written the report, I can just upload it to PowerBI to share with the team:
Look ma – it’s the same report!
Conclusion
If you’re not doing APM, then you need to get into AppInsights. If you’re already using AppInsigths, then it’s time to move beyond logging telemetry to actually analyzing telemetry and gaining insights from your applications using AppInights Analytics.
Happy analyzing!
